Virtual Audio Device Performances Debug.
VAD Debug Mode Procedure
Run the VAD in Debug mode and send us a screenshot of the VAD panel with the debug view open when your performance issues happen.
Procedure
- Click on the bottom version number to open the VAD debug metering mode.
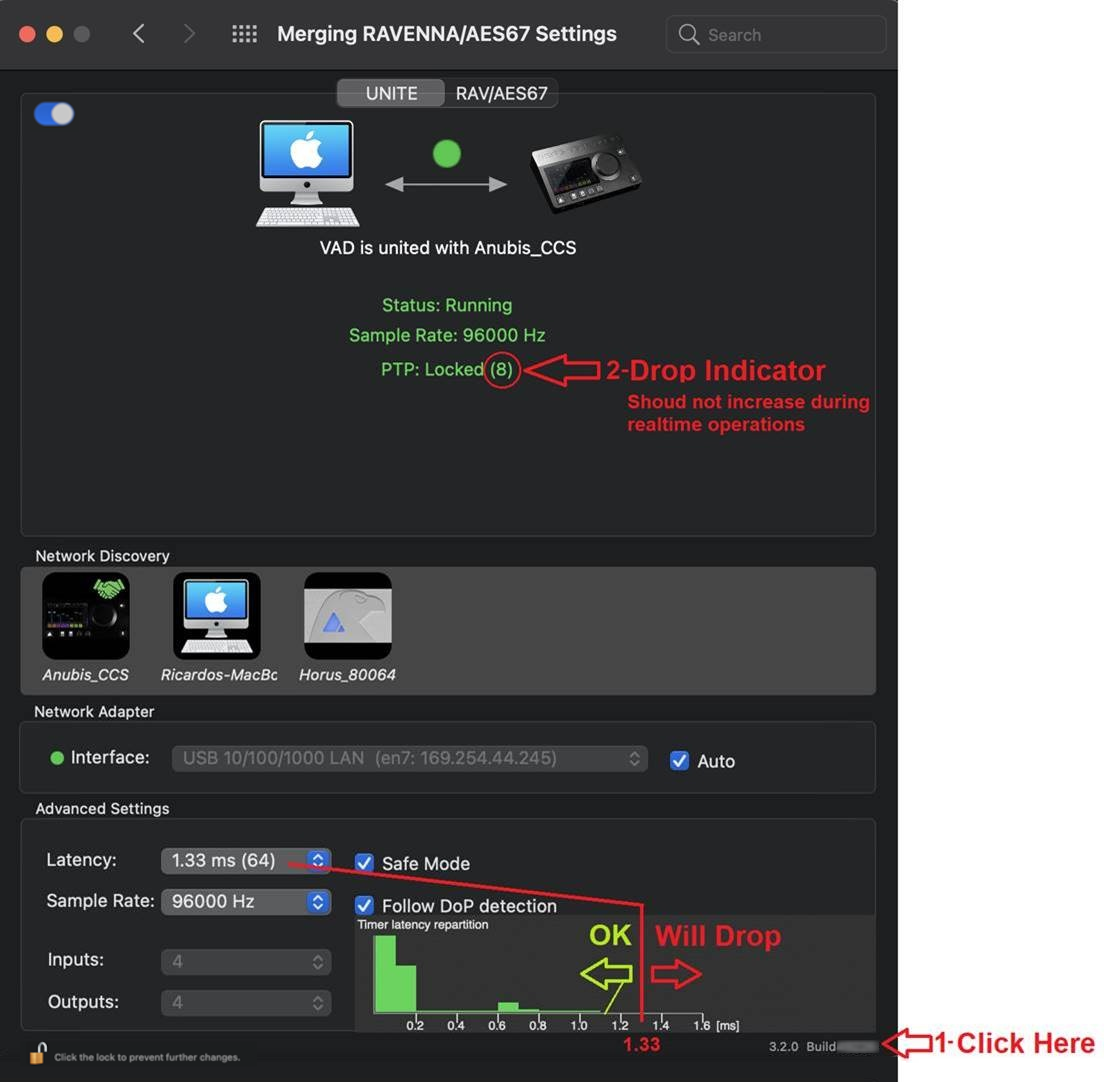
- You will see a drop indicator; this one should not increase during real-time operations. It will increase during sampling rate changes and launches but should not in real-time, such as during a recording or playback.
- Check the green meters readings, the bottom scale indicates the latency and what your system is capable of.
In the example here, the system can work with a latency of 1.33ms, it's latency goes up to 1.1ms (green arrow).
If the latency measurements would go above the 1.33ms (or if setting a lower latency), there will be drops as the system will not be able to handle those. with such configuration and apps in place.
So its important to set the latency according to what your system and setup is capable of.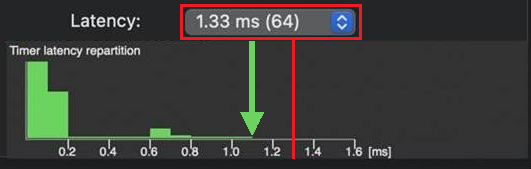
- Make a screenshot of the VAD panel when you have performance issues.
- Finally, please close the Debug mode once you are done as this one consumes extra resources, it’s not recommend to run it permanently.
Click on the version number to close it out. - Please send us the VAD Panel screenshot, your VAD driver and MacOS versions, your RAVENNA/AES67 device(s) and firmware version, and additional remarks if required.